A Preclinical Study of Electrolaryngeal Voice Conversion for a Novel Nasal Electrolarynx: Feature Choice and Data Augmentation
Abstract
Electrolaryngeal (EL) speech often exhibits reduced intelligibility and naturalness due to imperfect excitation and fixed pitch. In this preclinical study, we present the first systematic investigation of electrolaryngeal voice conversion (ELVC) for speech produced by a newly invented nasal electrolarynx (NEL), extending previous work that mainly targets cervical EL (CEL) speech. We examine the choice of features under NEL’s distinctive acoustics by comparing Mel-spectrograms and WavLM features as input to a seq2seq ELVC system. To address NEL data scarcity, we propose an LLE-VC-based augmentation strategy to synthesize paired sNEL–sNL speech for VC pretraining. Experiments reveal device-dependent trends: WavLM features benefit CEL-oriented conversion and augmentation, whereas Mel-spectrogram inputs better preserve NEL-specific spectral characteristics and yield better intelligibility-related metrics and listener preferences for NEL-to-NL conversion.
Architecture and Experimental Settings
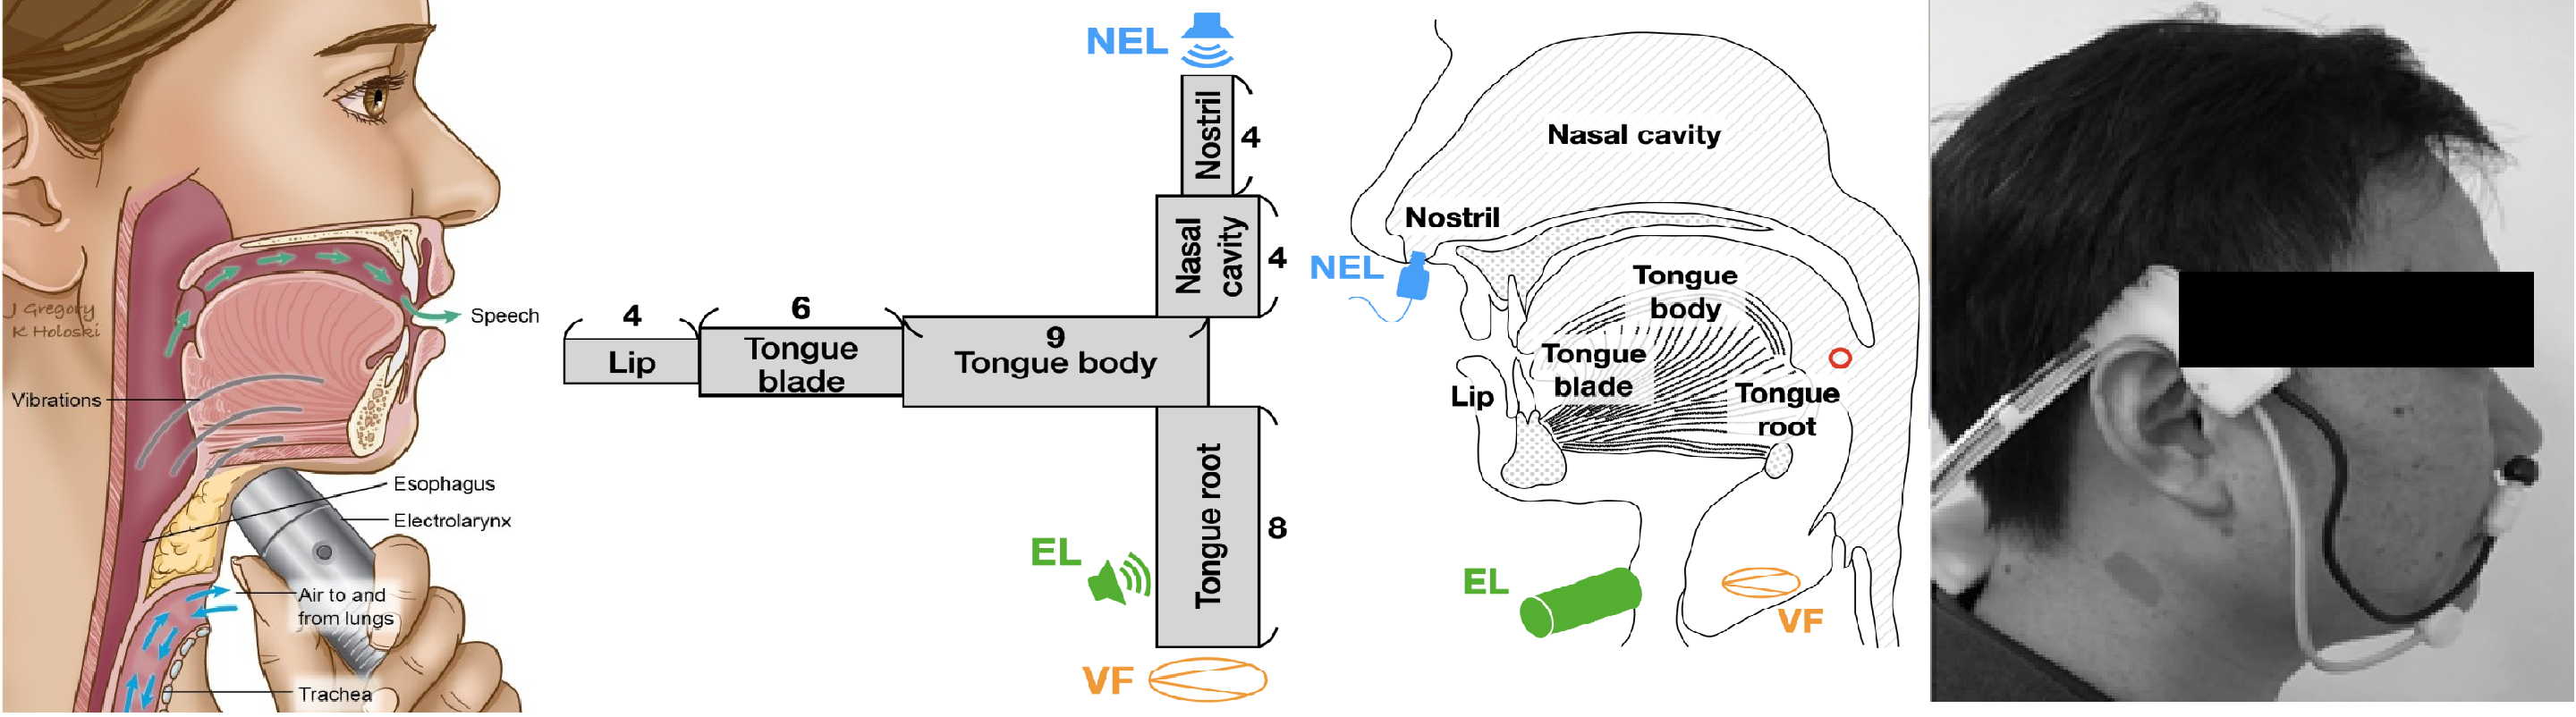
Fig. 1. Overview of CEL and NEL speech production. The leftmost panel shows the use of a traditional cervical EL (CEL) device, the rightmost panel shows the use of a nasal EL (NEL) device, and the two middle panels illustrate the excitation pathways of the two EL devices.
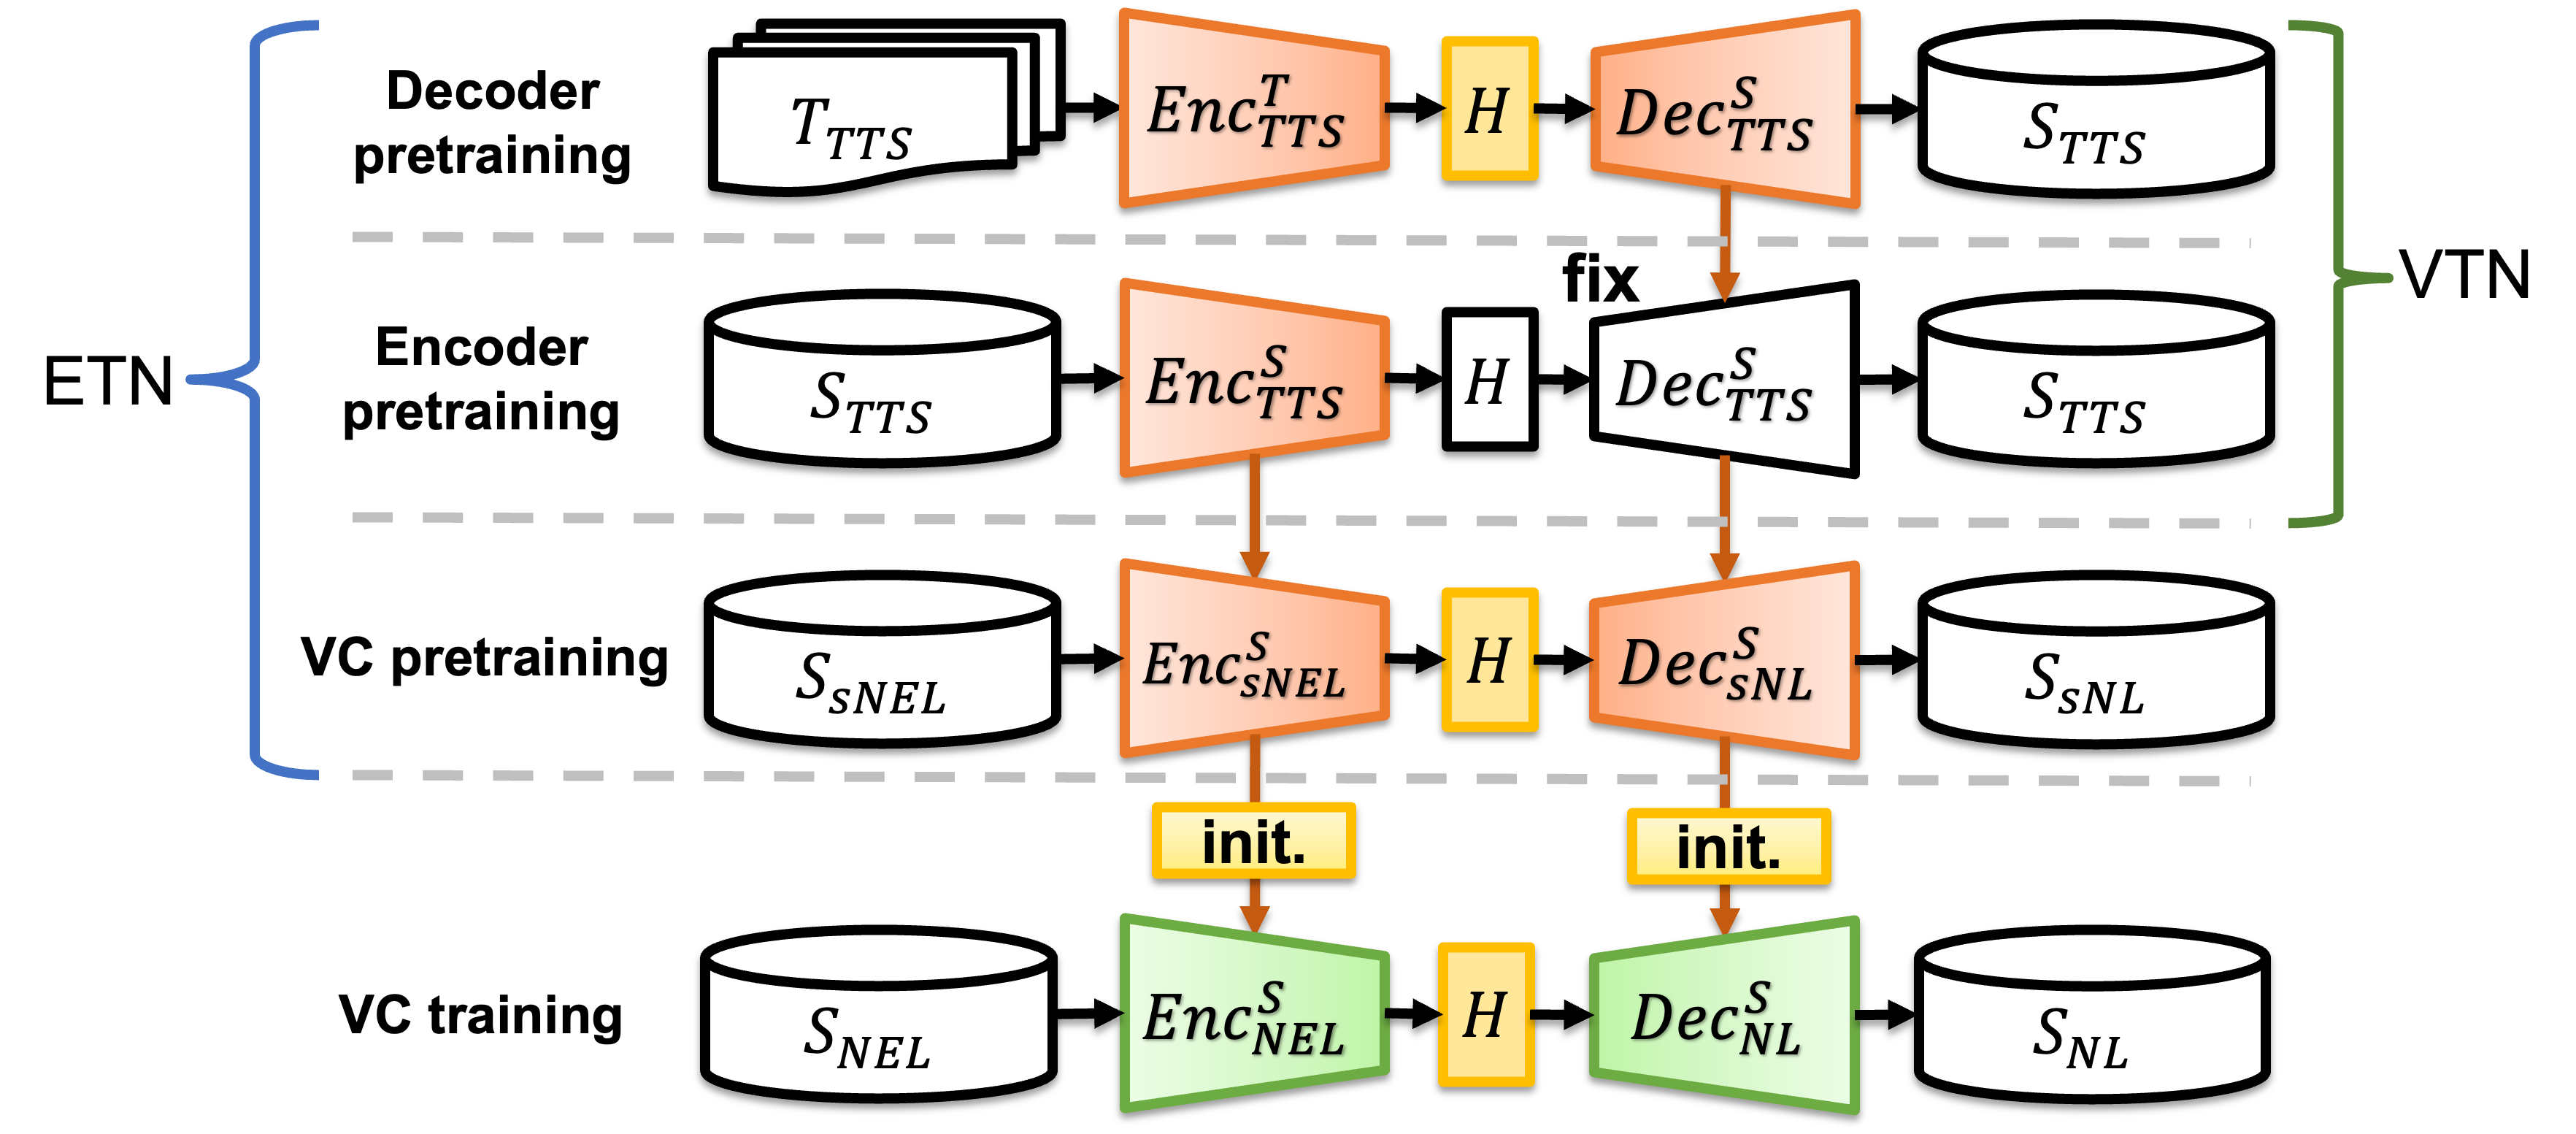
Fig. 2. The training process of VTN-VC and ETN-VC models.
EL Dataset
- CEL–NL: 320 parallel utterances (TMHINT sentences)
- NEL–NL: 320 parallel utterances (TMHINT sentences)
- All recorded by the same healthy speaker; NL and CEL in a studio, NEL in a hospital ward
- 240 / 40 / 40 pairs for training / development / evaluation
Pretraining Data
- COSPRO: 45k utterances (44 h) for decoder and encoder pretraining
- TWnews: 10k sNEL–sNL synthetic pairs for VC pretraining (1k / 5k / 10k subsets compared)
- Features: 80-dim Mel-spectrogram (16 kHz) or 1024-dim WavLM-Large layer-6 features; HiFi-GAN vocoder trained per feature type
Evaluation Metrics
Spectral Distortion
- MCDMel-cepstral distortion ↓
Intelligibility
- CERCharacter error rate (Whisper-Large ASR) ↓
- SERSyllable error rate (Mandarin syllable recognizer trained on MATBN) ↓
F0 / Pitch
- F0 RMSERoot mean square error of F0 ↓
- F0 CORRCorrelation of F0 contours ↑
Duration
- DDURAverage absolute duration difference ↓
Neural Assessment
- UTMOSMOS prediction ↑
- MOSA-Net+Quality and intelligibility scores ↑
- SpeechBERTScoreSemantic fidelity ↑
Subjective
- A/B Test30 native Mandarin listeners select the more intelligible sample or "no preference."
Experimental Results
Table I. Performance comparison of VTN-VC models on CEL/NEL-to-NL tasks. Metrics of unprocessed raw speech are included for reference. (↑ indicates higher is better, ↓ indicates lower is better.) CER and SER are reported as mean ± 95% confidence interval.
| Model | Feature | EL Type | MCD ↓ | f0RMSE ↓ | f0CORR ↑ | DDUR ↓ | CER (%) ↓ | SER (%) ↓ |
|---|---|---|---|---|---|---|---|---|
| ✗ | ✗ | CEL | 10.79 | 34.10 | -0.08 | 0.88 | 75.3 ± 6.15 | 69.3 ± 5.2 |
| NEL | 13.75 | 48.81 | 0.02 | 2.68 | 90.8 ± 2.41 | 89.5 ± 6.3 | ||
| VTN-VC | Mel-spectrogram | CEL | 5.88 | 34.46 | 0.27 | 0.11 | 73.3 ± 6.33 | 64.5 ± 5.6 |
| NEL | 5.66 | 34.62 | 0.25 | 0.25 | 72.0 ± 6.64 | 58.8 ± 6.4 | ||
| WavLM | CEL | 5.97 | 33.57 | 0.30 | 0.20 | 69.0 ± 6.65 | 57.5 ± 6.3 | |
| NEL | 6.12 | 33.32 | 0.31 | 0.29 | 71.5 ± 7.68 | 62.0 ± 5.6 |
Although NEL speech yields worse metric values and higher ASR errors than CEL speech, the overall conversion difficulty is comparable. Feature preferences are opposite across devices: Mel-spectrograms work better for NEL-to-NL, whereas WavLM features are more effective for CEL-to-NL.
| System | CEL SER (%) ↓ | NEL SER (%) ↓ |
|---|---|---|
| SeedVC | 71.8 | 84.8 |
| MKL-VC | 85.0 | 99.5 |
| Vevo | 84.0 | 101.5 |
SER of several zero-/few-shot VC systems on CEL and NEL speech. These results suggest that general-purpose zero-shot VC is insufficient for CEL/NEL speech, motivating the need to tailor and adapt VC models to their unique acoustic characteristics.
Table II. ETN-VC trained on the TMHINT training set with 1k/5k/10k TWnews utterances. CER and SER are reported as mean ± 95% confidence interval.
| Model | Feature | VC Pretraining Data | MCD ↓ | f0RMSE ↓ | f0CORR ↑ | DDUR ↓ | CER (%) ↓ | SER (%) ↓ | |
|---|---|---|---|---|---|---|---|---|---|
| TWnews | TMHINT | ||||||||
| ETN-VC | Mel-spectrogram | 1K | ✓ | 5.64 | 33.97 | 0.27 | 0.14 | 66.5 ± 7.72 | 58.8 ± 5.1 |
| 5K | ✓ | 5.63 | 33.23 | 0.30 | 0.16 | 66.3 ± 7.62 | 59.3 ± 5.4 | ||
| 10K | ✓ | 5.56 | 34.11 | 0.28 | 0.14 | 63.0 ± 7.37 | 53.8 ± 4.8 | ||
| WavLM | 1K | ✓ | 6.01 | 33.39 | 0.31 | 0.27 | 71.3 ± 7.01 | 61.8 ± 5.6 | |
| 5K | ✓ | 6.07 | 34.18 | 0.29 | 0.28 | 68.8 ± 6.75 | 58.0 ± 5.8 | ||
| 10K | ✓ | 6.09 | 34.00 | 0.29 | 0.27 | 65.8 ± 7.39 | 54.3 ± 5.6 | ||
ETN-VC (with data augmentation) outperforms VTN-VC regardless of the feature type, and the performance improves with increasing augmentation data. Compared with VTN-VC using Mel-spectrograms (Table I), the best ETN-VC model with Mel-spectrograms reduces the CER from 72.0% to 63.0% and the SER from 58.8% to 53.8%.
Table III. SpeechBERTScore, UTMOS, and MOSA-Net+ scores for NEL, NL, and converted speech (mean ± 95% confidence interval).
| Model | SpeechBERTScore ↑ | UTMOS ↑ | MOSA-Net+ | |
|---|---|---|---|---|
| Quality ↑ | Intelligibility ↑ | |||
| NEL Speech | 0.523 ± 0.006 | 1.299 ± 0.005 | 2.153 ± 0.062 | 0.642 ± 0.022 |
| VTN-VC Mel | 0.674 ± 0.008 | 2.469 ± 0.071 | 3.511 ± 0.076 | 0.969 ± 0.004 |
| VTN-VC WavLM | 0.678 ± 0.008 | 2.944 ± 0.092 | 3.783 ± 0.093 | 0.980 ± 0.004 |
| ETN-VC Mel | 0.675 ± 0.009 | 2.666 ± 0.084 | 3.584 ± 0.079 | 0.973 ± 0.004 |
| ETN-VC WavLM | 0.674 ± 0.007 | 2.998 ± 0.094 | 3.788 ± 0.073 | 0.981 ± 0.003 |
| NL Speech | 1.000 ± 0.000 | 3.261 ± 0.069 | 4.510 ± 0.076 | 0.996 ± 0.001 |
WavLM-based VC models achieve higher non-intrusive neural assessment scores (UTMOS and MOSA-Net+), suggesting smoother prosody and more natural signal flow. In contrast, Mel-spectrogram-based models perform better on intelligibility-related metrics (CER/SER) and in A/B tests, highlighting the trade-off between naturalness and intelligibility. SpeechBERTScore differences are small across systems, indicating good semantic preservation after conversion. Given the medical context of NEL speech, intelligibility is the focus of this study.
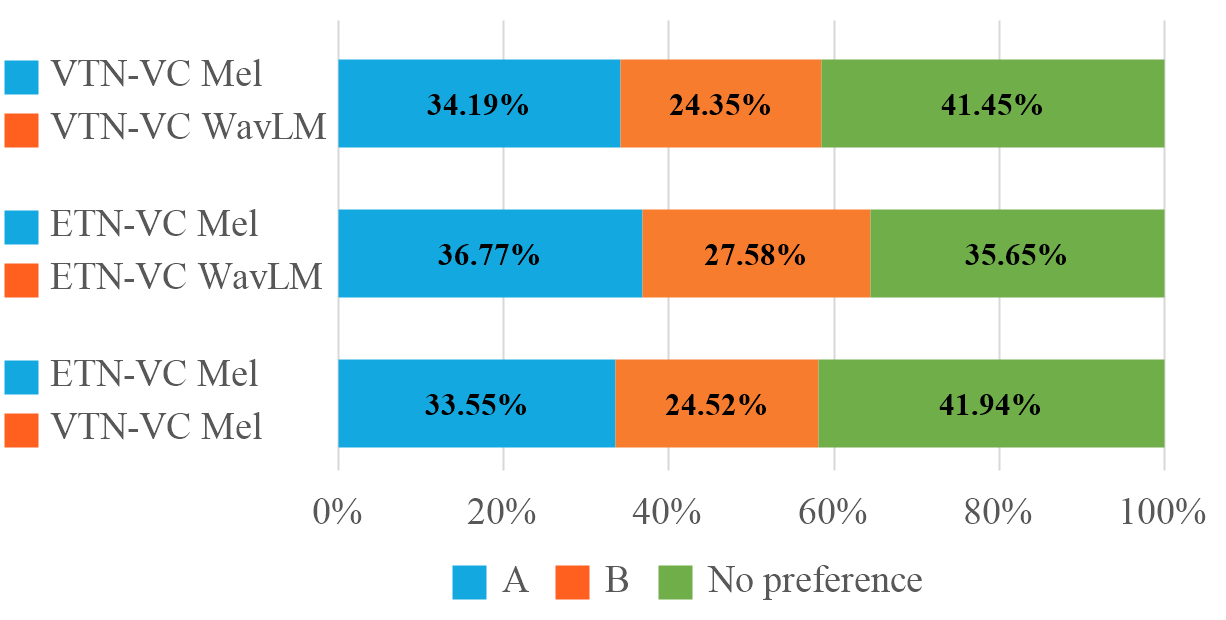
Fig. 4. A/B test results on intelligibility. The bars represent the percentage of subjects' voting for each system. Three sets of A/B tests were conducted with 30 participants (native Mandarin speakers, 18 males and 12 females, aged 20–50, self-reported normal hearing). Mel-spectrogram-based VTN-VC and ETN-VC both outperform their WavLM-based counterparts, and ETN-VC with Mel-spectrograms outperforms VTN-VC with Mel-spectrograms, confirming the benefit of data augmentation for nasal ELVC.
Audio Samples
CEL conversion uses WavLM features; NEL conversion uses Mel-spectrograms.
Spectrogram Analysis
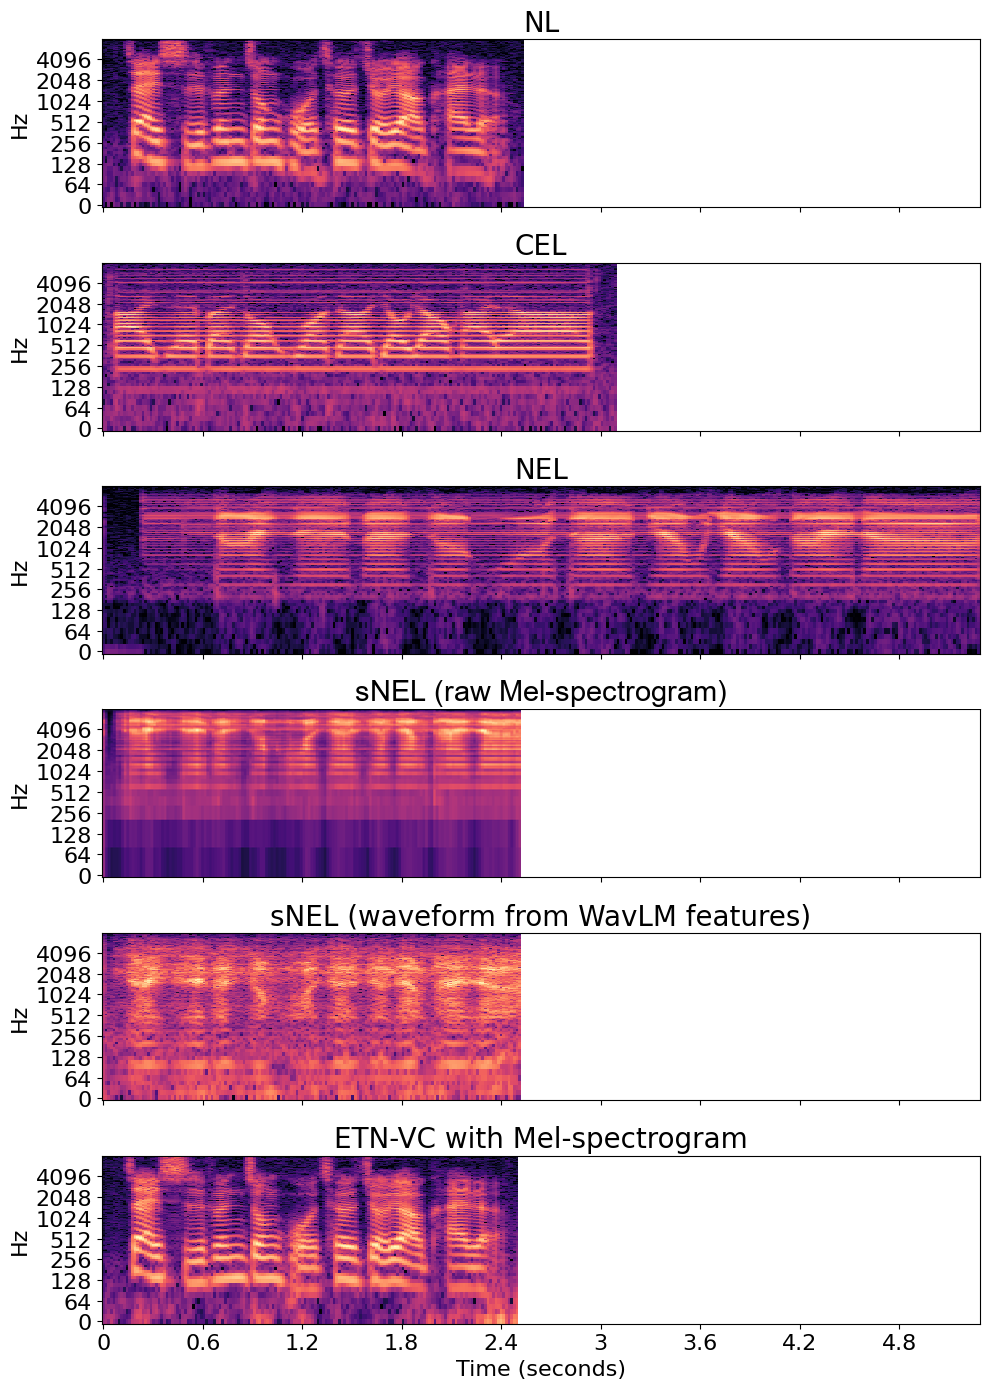
Fig. 3. Mel-spectrograms of NL, CEL, NEL, sNEL, and ETN-VC-converted speech. NEL speech is longer, while sNEL and converted speech follow the NL duration due to frame-wise conversion and seq2seq alignment, respectively. Mel-spectrograms synthesized directly by LLE-VC preserve the mid-high-frequency resonance of NEL speech much better, whereas sNEL speech generated from reconstructed WavLM features fails to preserve this resonance and introduces low-frequency noise.
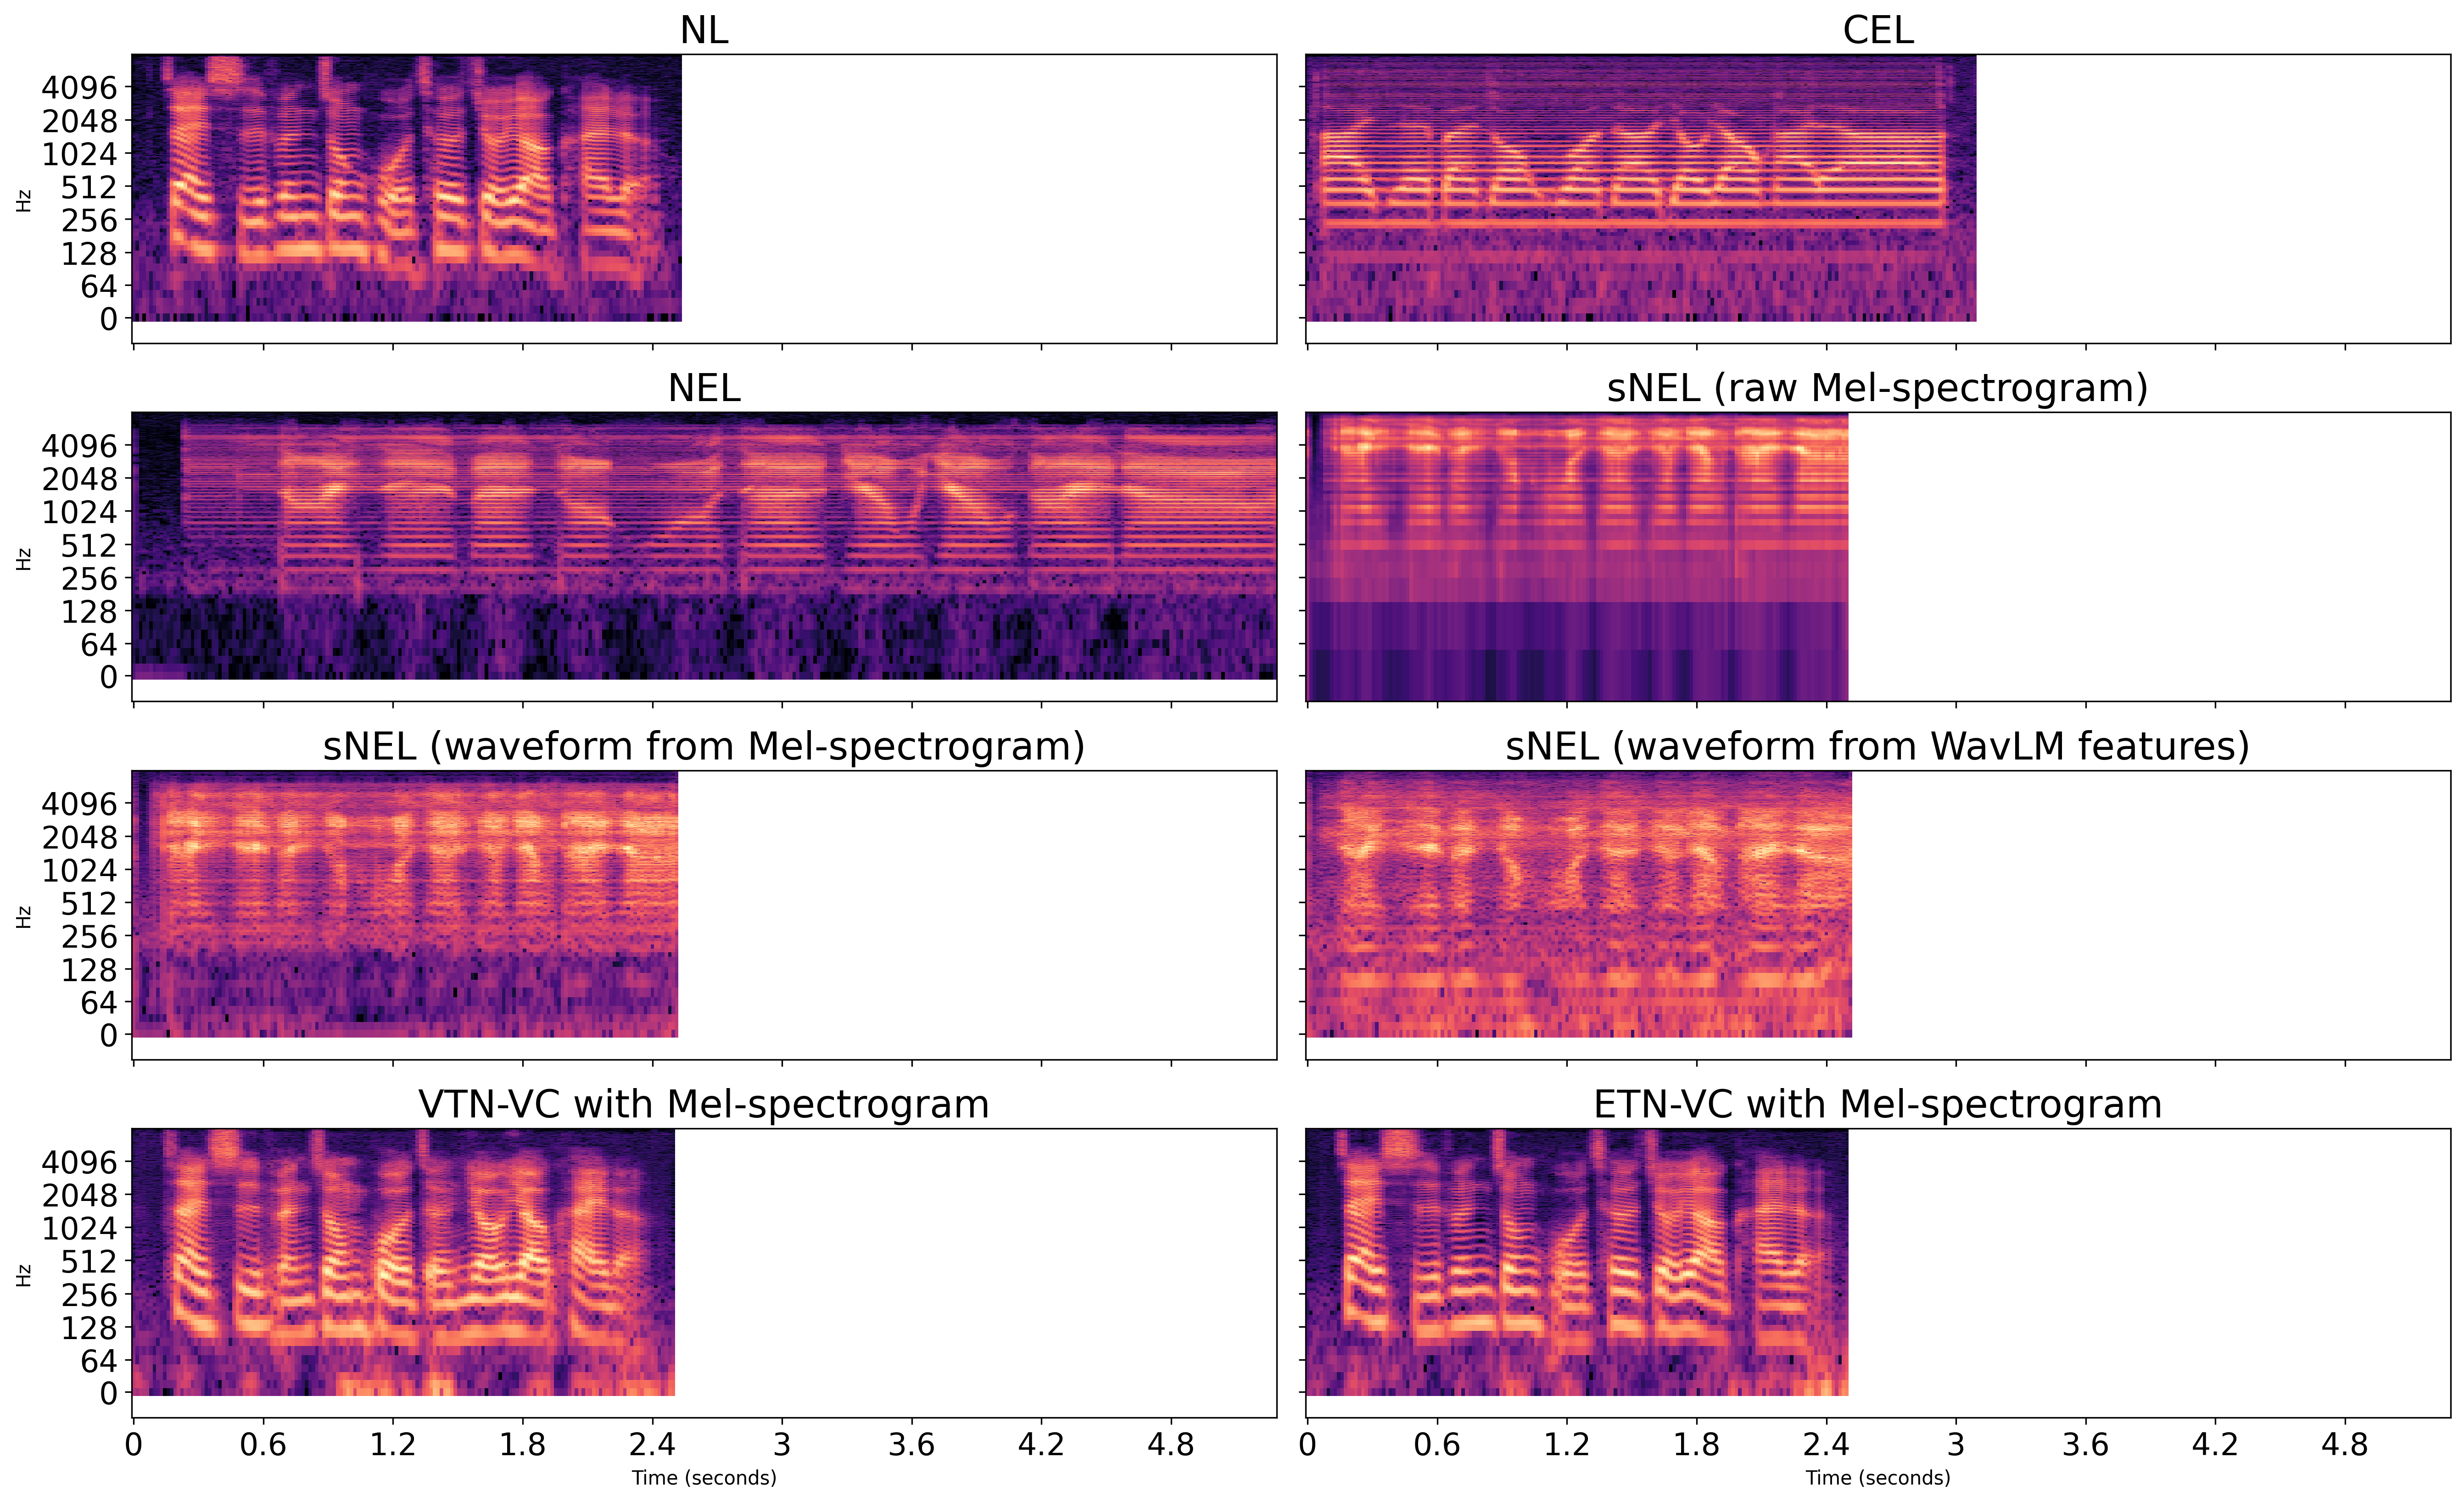
Fig. 3 (extended). Extended version of Fig. 3 with two additional panels: sNEL synthesized via the "Mel-spectrogram → waveform → Mel-spectrogram" route, which exhibits a similar but milder loss of the NEL resonance, and the output of VTN-VC with Mel-spectrograms for comparison with ETN-VC.
Conclusion
This paper presents a preclinical, systematic study of ELVC for a newly invented NEL device, extending previous ELVC work that mainly targets CEL speech. To mitigate NEL data scarcity, we propose an LLE-VC-based data augmentation strategy that synthesizes paired sNEL–sNL speech for VC pretraining, yielding consistent gains in NEL-to-NL conversion. Our experiments further show that feature choice is device-dependent: WavLM features benefit CEL-to-NL ELVC, whereas Mel-spectrogram inputs better preserve NEL-specific spectral characteristics and lead to improved intelligibility-related metrics and listener preferences for NEL-to-NL conversion. Because this preclinical study used the speech of a single healthy speaker, validation with real patient NEL speech remains an important next step. Future work will collect patient NEL data for formal perceptual evaluation, including naturalness MOS, and will examine broader SSL features, such as layer sweeps and alternative encoders.